Paardenmarkt deposits
We used a laser diffractometer (Picture 1) to determine grain-size distributions of sediment samples from various depths in different cores. Laser diffractometry utilises diffraction patterns of a laser beam that passes through objects, i.e. suspended sediment particles, in order to quickly measure their geometrical dimensions. Water content can easily be determined by freeze-drying and heating up sediment to 105°C for 24 hours. Subsequently, combusting samples at 500°C for 4 hours in a muffle furnace (Picture 2) burns off all organic components. The loss of weight directly reflects the sample’s organic content. To obtain downcore profiles of geophysical properties, we used a Geotek Multi-Sensor Core Logger (MSCL; Picture 3). An MSCL automatically moves a split core down a track past a series of sensors that perform high-resolution measurements. Combined information from all analyses allows us to get a complete picture of the nature, and the lateral and vertical variations of deposits in the Paardenmarkt area.
Paardenmarkt deposits are mainly marked by sand and/or silt fractions, and a minimal admixture of clay. Sediments are deposited in a semi-parallel configuration mostly, often arranged in sequences of rhythmic layers (Picture 4). Such stratigraphy typically reflects a dynamic depositional environment characterised by phases of accumulation and erosion, associated with a range of coastal processes, such as wave action ─ potentially related to storms ─, tidal currents and anthropogenic disturbances (e.g. dredging, construction works, etc.). Mean grain size shows an inverse correlation with water and organic content, signifying that silty sediment can hold more water, i.e. up to 60 weight%, and organic compounds, i.e. up to 20 weight%, compared to sandy sediment. Since most natural gases are a product of biogenic decomposition of organic material, muddy sediments are considered a more hospitable environment for microbial colonies to thrive, metabolise and produce e.g. methane. Gas concentration analyses will verify this theory.
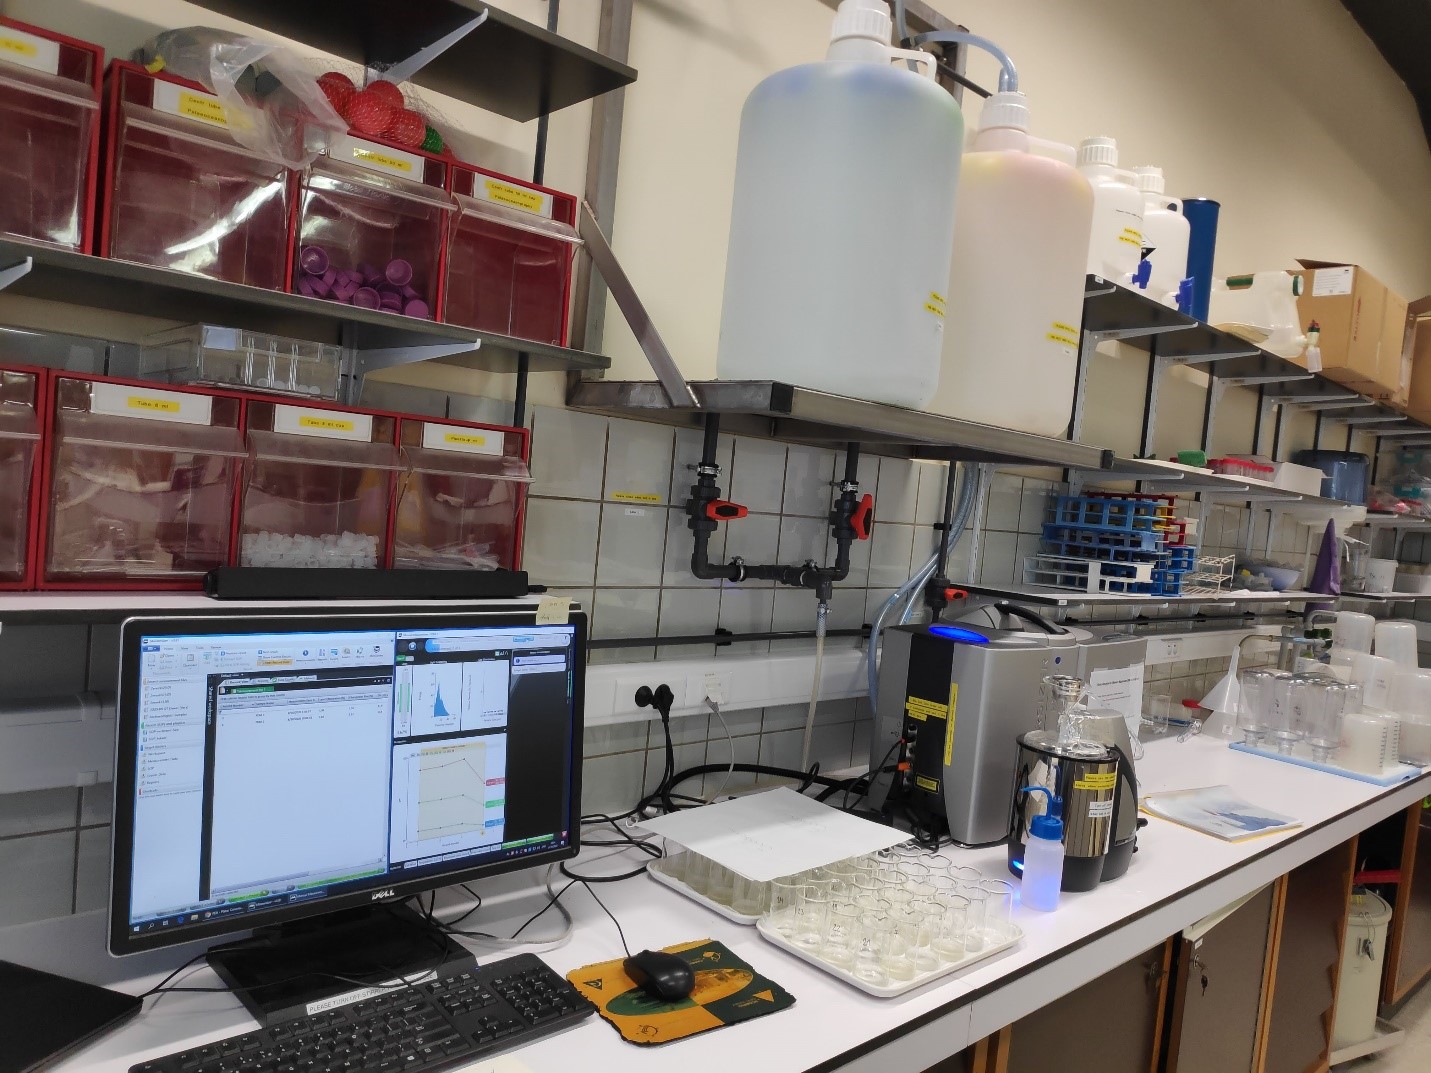
Picture 1: Malvern laser diffractometer (UGent) with computer display to view measurement output, e.g. grain-size distributions.
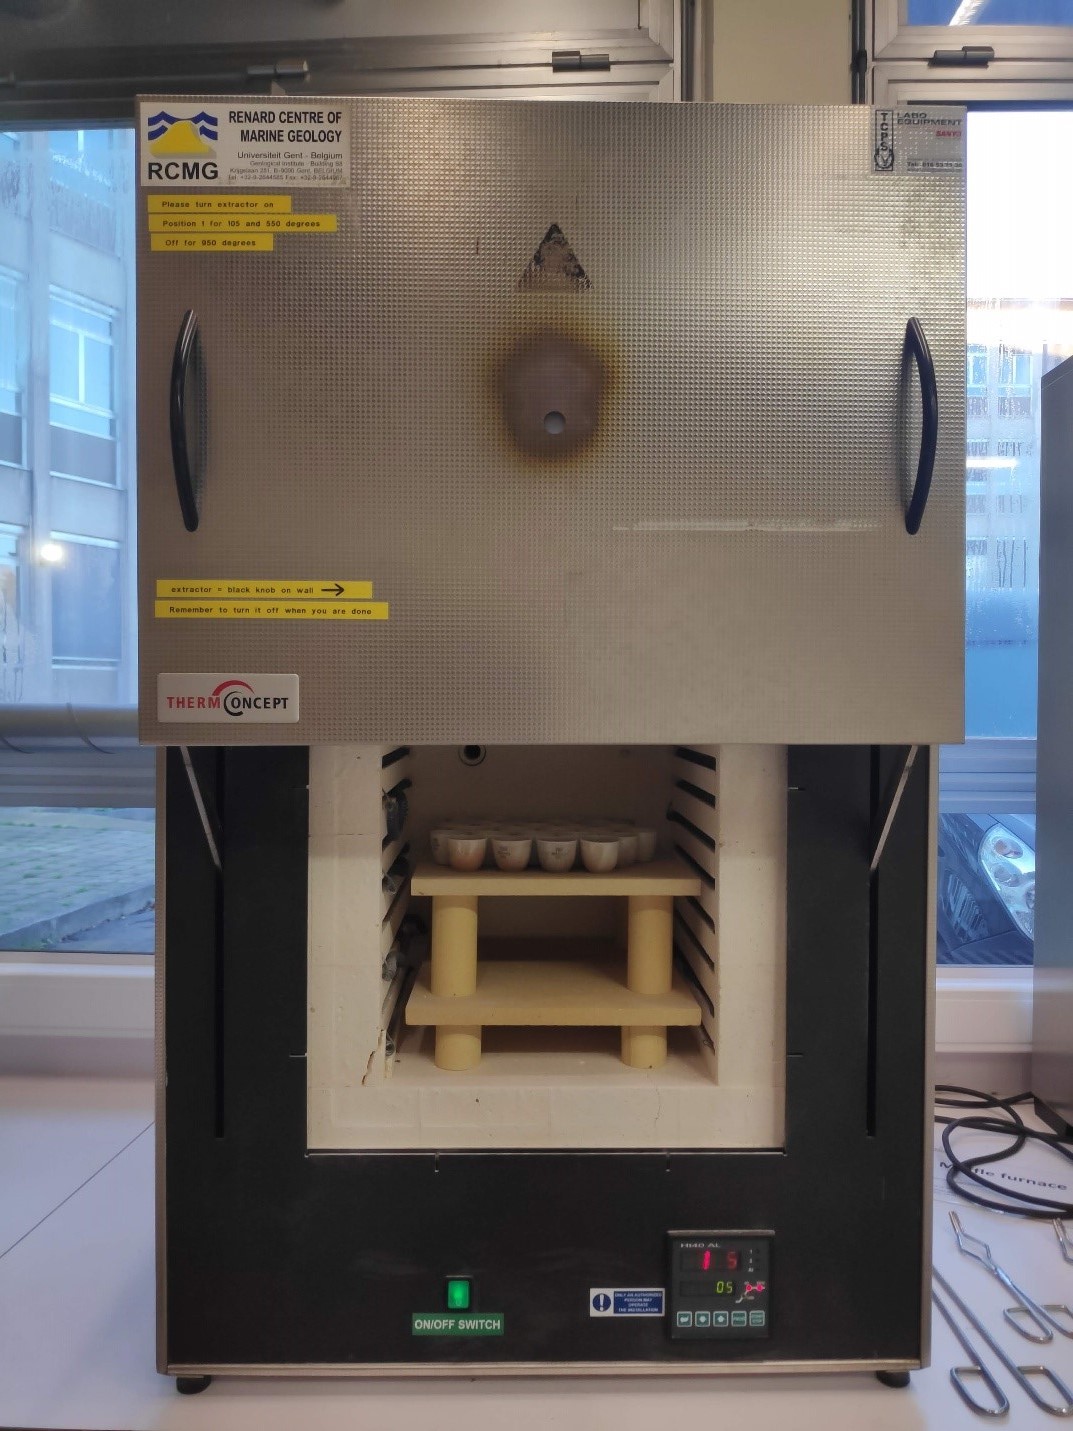
Picture 2: Muffle furnace in which small sediment samples in crucibles are heated to 550°C for 4 hours.
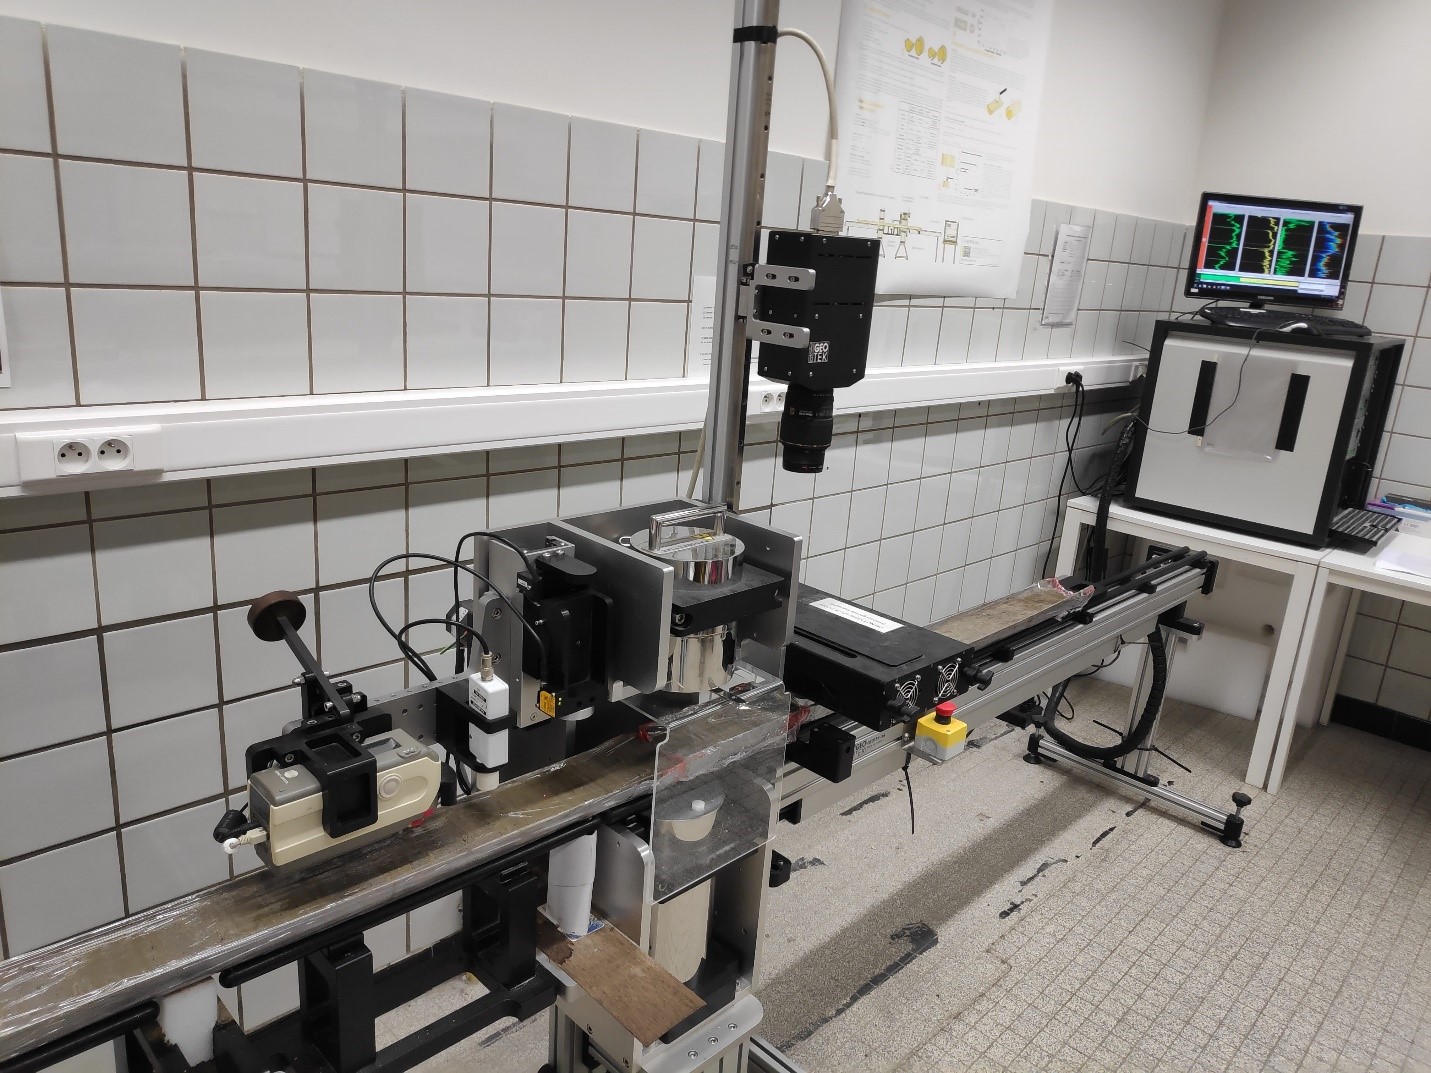
Picture 3: Geotek Multi-Sensor Core Logger (UGent). Measurements of density and magnetic susceptibility are executed with a downcore resolution of 2 mm on a split core, pushed underneath the sensor array. Results are displayed on a computer screen.
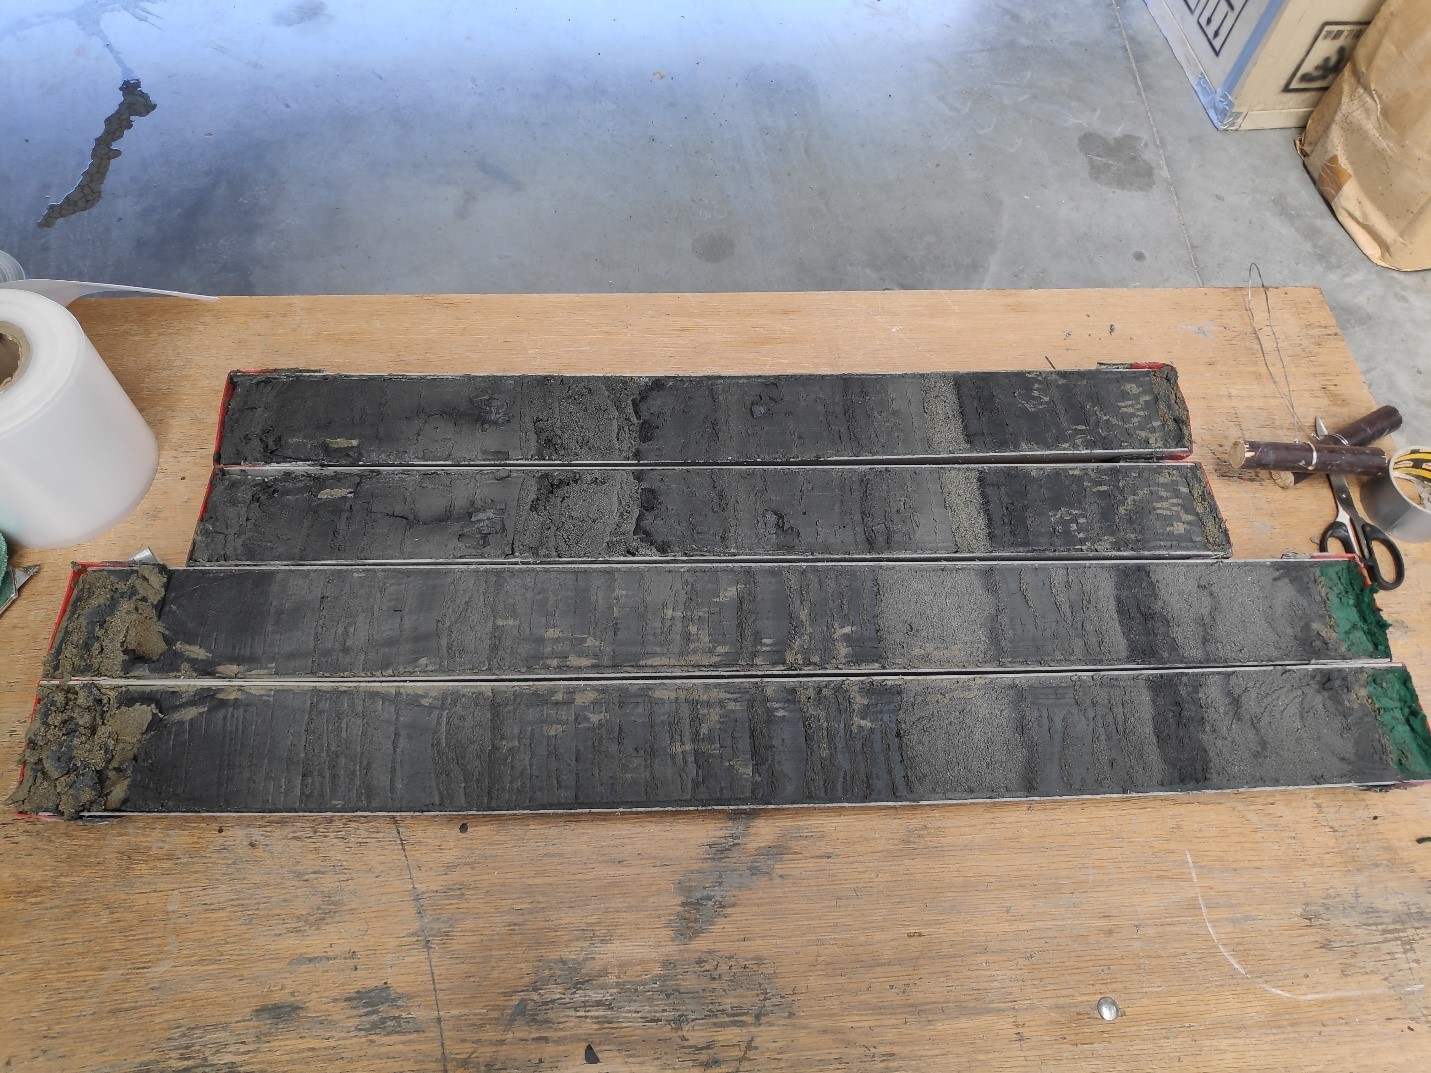
Picture 4: Split core with rhythmic deposits of silt and sand. Some oxidation spots (brown) signify the presence of bioturbation.
 Website developed and maintained by